Original Link: https://www.anandtech.com/show/6143/ocz-agility-4-256gb-review
OCZ Agility 4 (256GB) Review
by Kristian Vättö on September 1, 2012 1:00 PM ESTIntroduction
For the last few years, OCZ's consumer SSD lineup has primarily consisted of two models: Vertex and Agility. The history of these two goes all the way back to 2009 when OCZ realized that they can differentiate their SSDs by equipping them with different quality NAND. In first and second generation Vertex and Agility SSDs, the difference between the NAND was the manufacturer and process node. First generation Vertex used strictly Samsung NAND, whereas Agility opened the doors of cheaper prices by using Intel and Toshiba NAND. Back then, Samsung was in control of the SSD and NAND market, which allowed them to price themselves higher than others. With second generation Vertex and Agility, OCZ switched to SandForce's SF-1221 controller and Vertex 2 used Micron NAND, while Agility 2 used Intel NAND.

The Vertex 3 and Agility 3 finally brought some clearer differences. The difference was no longer the manufacturer, it was the actual NAND interface. 25nm IMFT NAND and ONFi 2.x brought us synchronous logic and transfer speeds of up to 200MB/s. However, manufacturing ONFi 1.0 NAND is cheaper, which is why IMFT has continued to manufacture slower asynchronous NAND. After all, there are many products that don't benefit from the faster interface, such USB 2.0 memory sticks. Once again, OCZ saw that there was a niche for slightly cheaper and slower SSDs with asynchronous NAND. This time around OCZ wasn't the only one, though, as there are numerous other SandForce SSDs with asynchronous NAND (Mushkin Chronos, Corsair Force 3 and Patriot Pyro to name a few).
With the Vertex 4, OCZ switched to Marvell silicon, rebranded it Indilinx Everest 2 and built their own custom firmware. Vertex 4 used synchronous NAND which meant that there was room for an Agility 4. As expected, a month after the release of Vertex 4 OCZ launched Agility 4 with the same Everest 2 controller but with asynchronous NAND instead.
| NewEgg Price Comparison (8/31/2012) | ||||
| 60/64GB | 120/128GB | 240/256GB | 480/512GB | |
| OCZ Agility 4 | $65 | $100 | $190 | N/A |
| OCZ Agility 3 | $62 | $90 | $175 | $330 |
| Plextor M5S | $70 | $85 | $200 | N/A |
| Crucial m4 | $73 | $110 | $210 | $400 |
| Intel 520 Series | $100 | $132 | $230 | $500 |
| Samsung 830 Series | $85 | $119 | $230 | $570 |
| OCZ Vertex 3 | $70 | $85 | $180 | $500 |
| OCZ Vertex 4 | $65 | $110 | $190 | $530 |
Pricing is very close to the Vertex 4, which is similar to what we saw between the Agility 3/Vertex 3.
As always, the pricing table is just to give us some idea of pricing. Prices change on a daily basis, hence it's advisable to follow the prices for a few days before pulling a trigger. NAND pricing can be extremely volatile, often resulting in heavy discounting.
The Agility 4
Besides the sticker, Vertex 4 and Agility 4 are virtually identical.
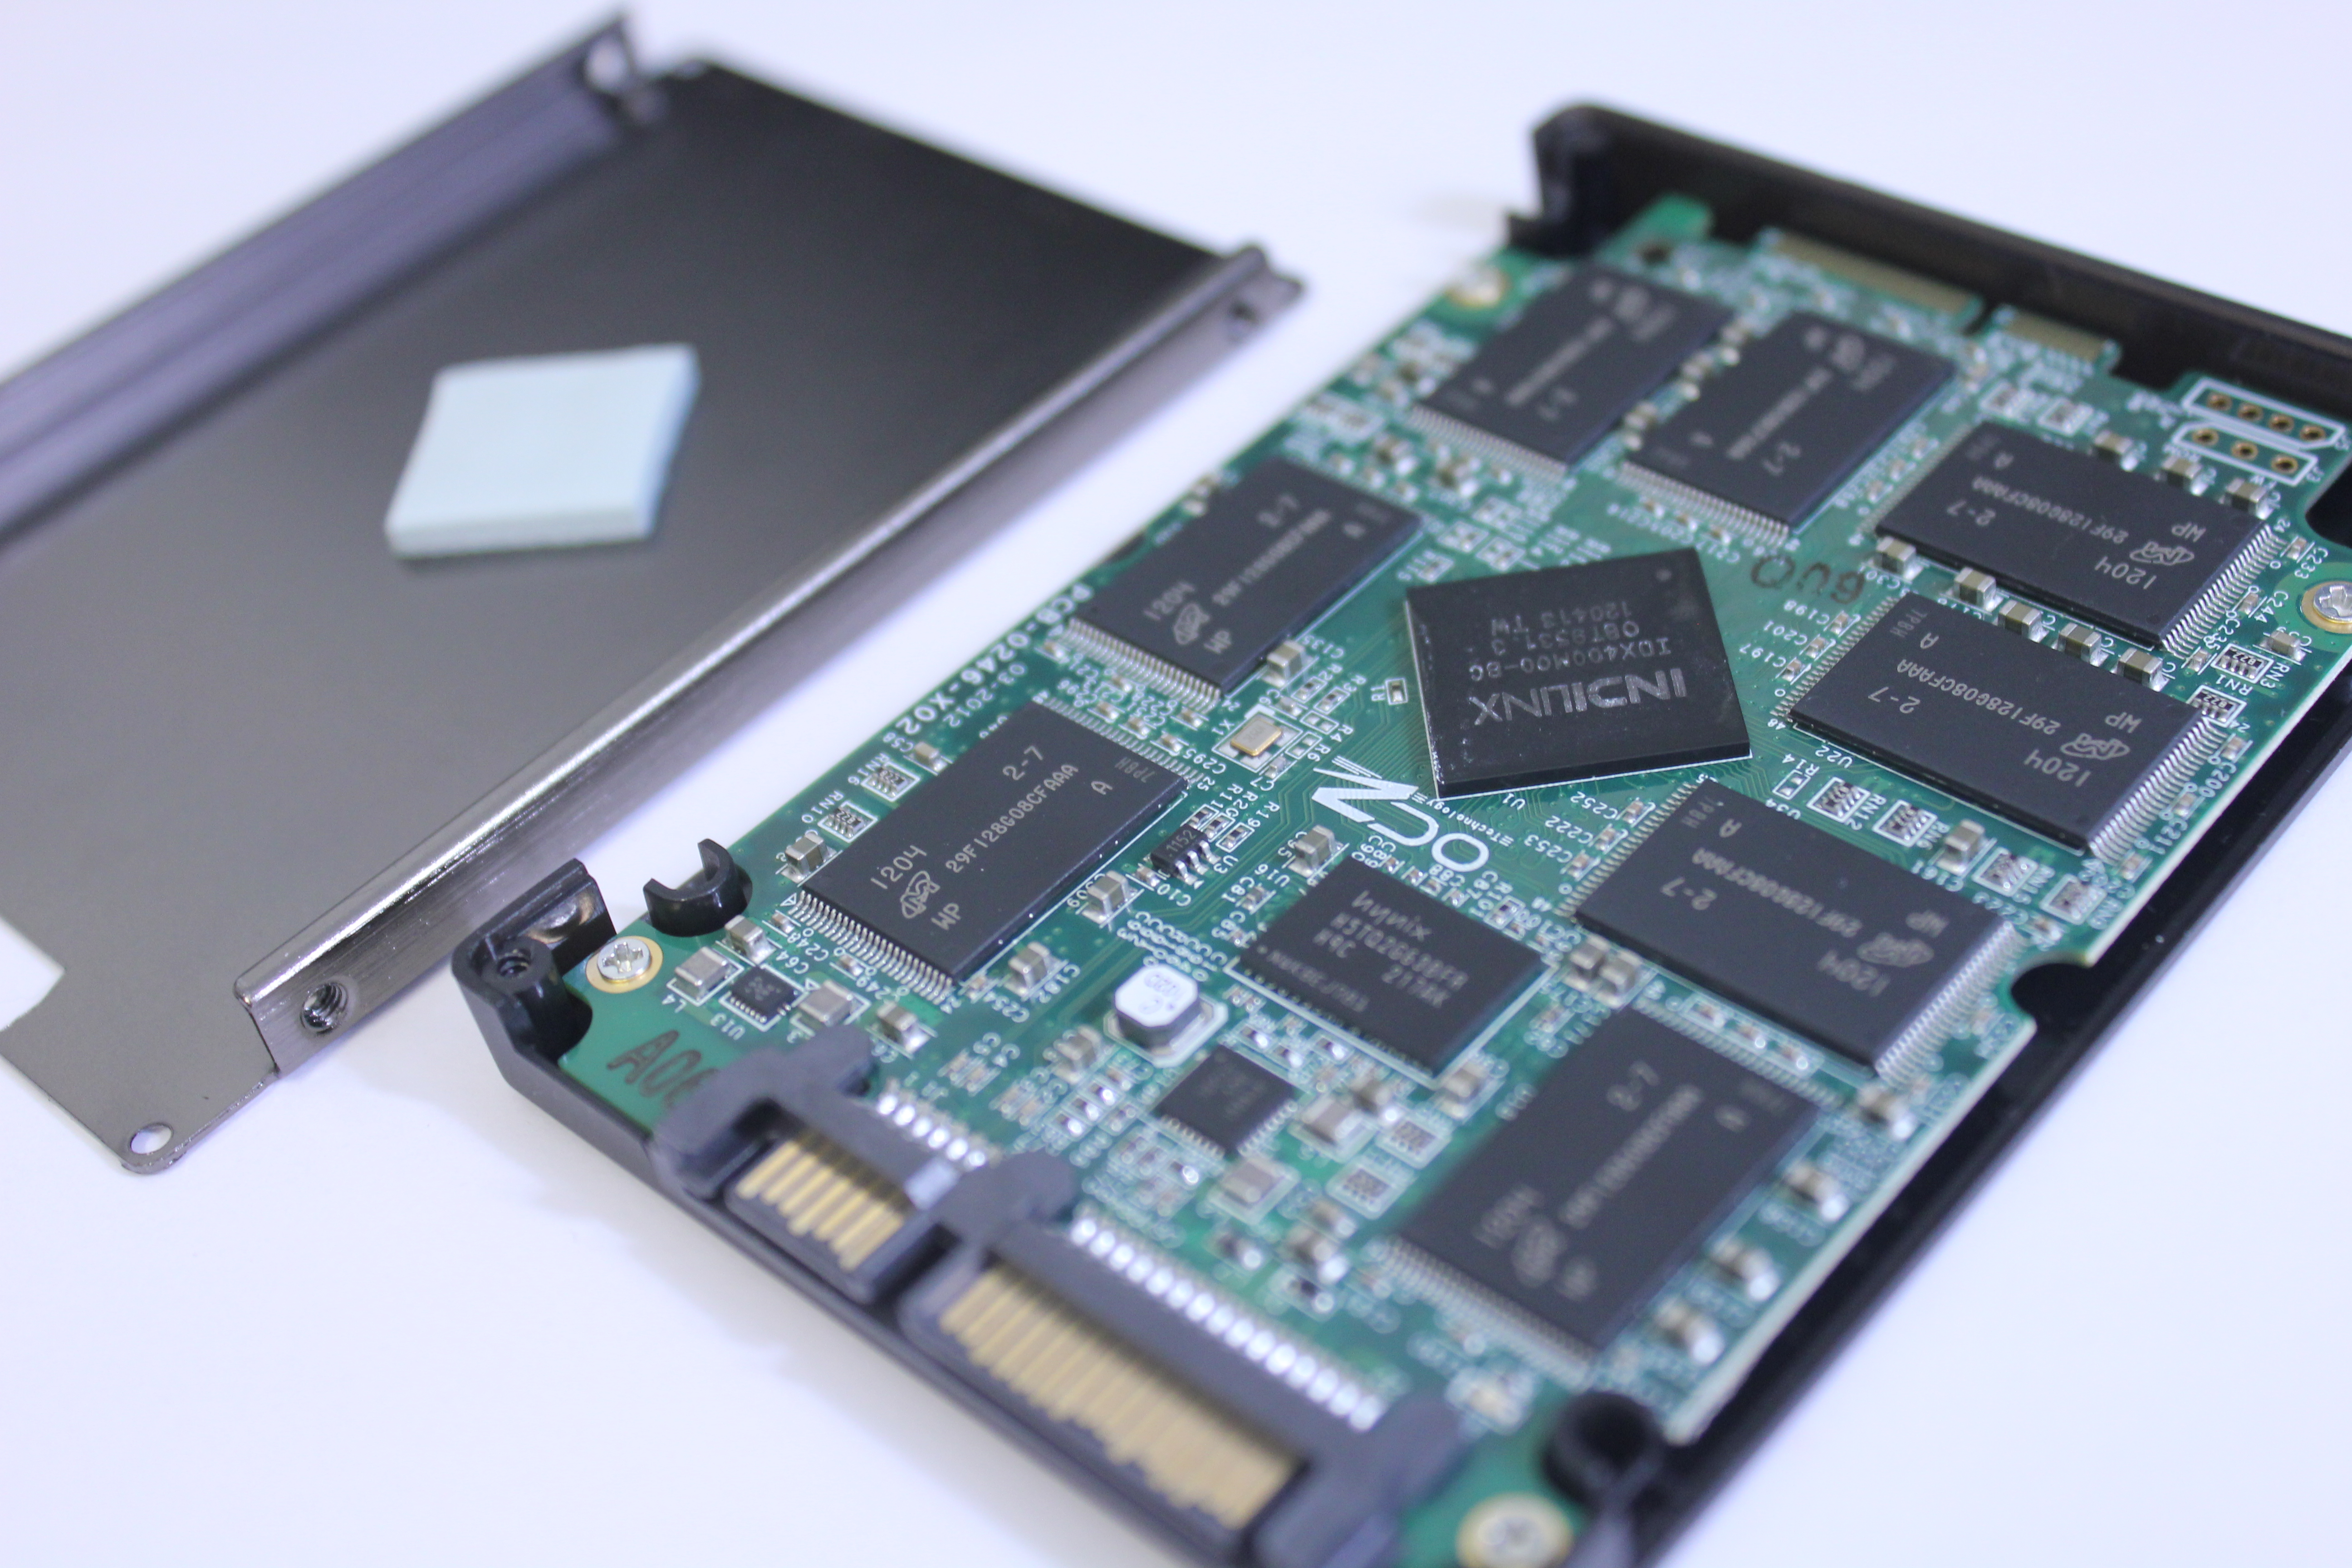
The PCB is actually screwed to the top part of the chassis, which is not very common. The top part of the chassis is made out of plastic, whereas the bottom part is metal. There's also a single thermal pad for the controller.
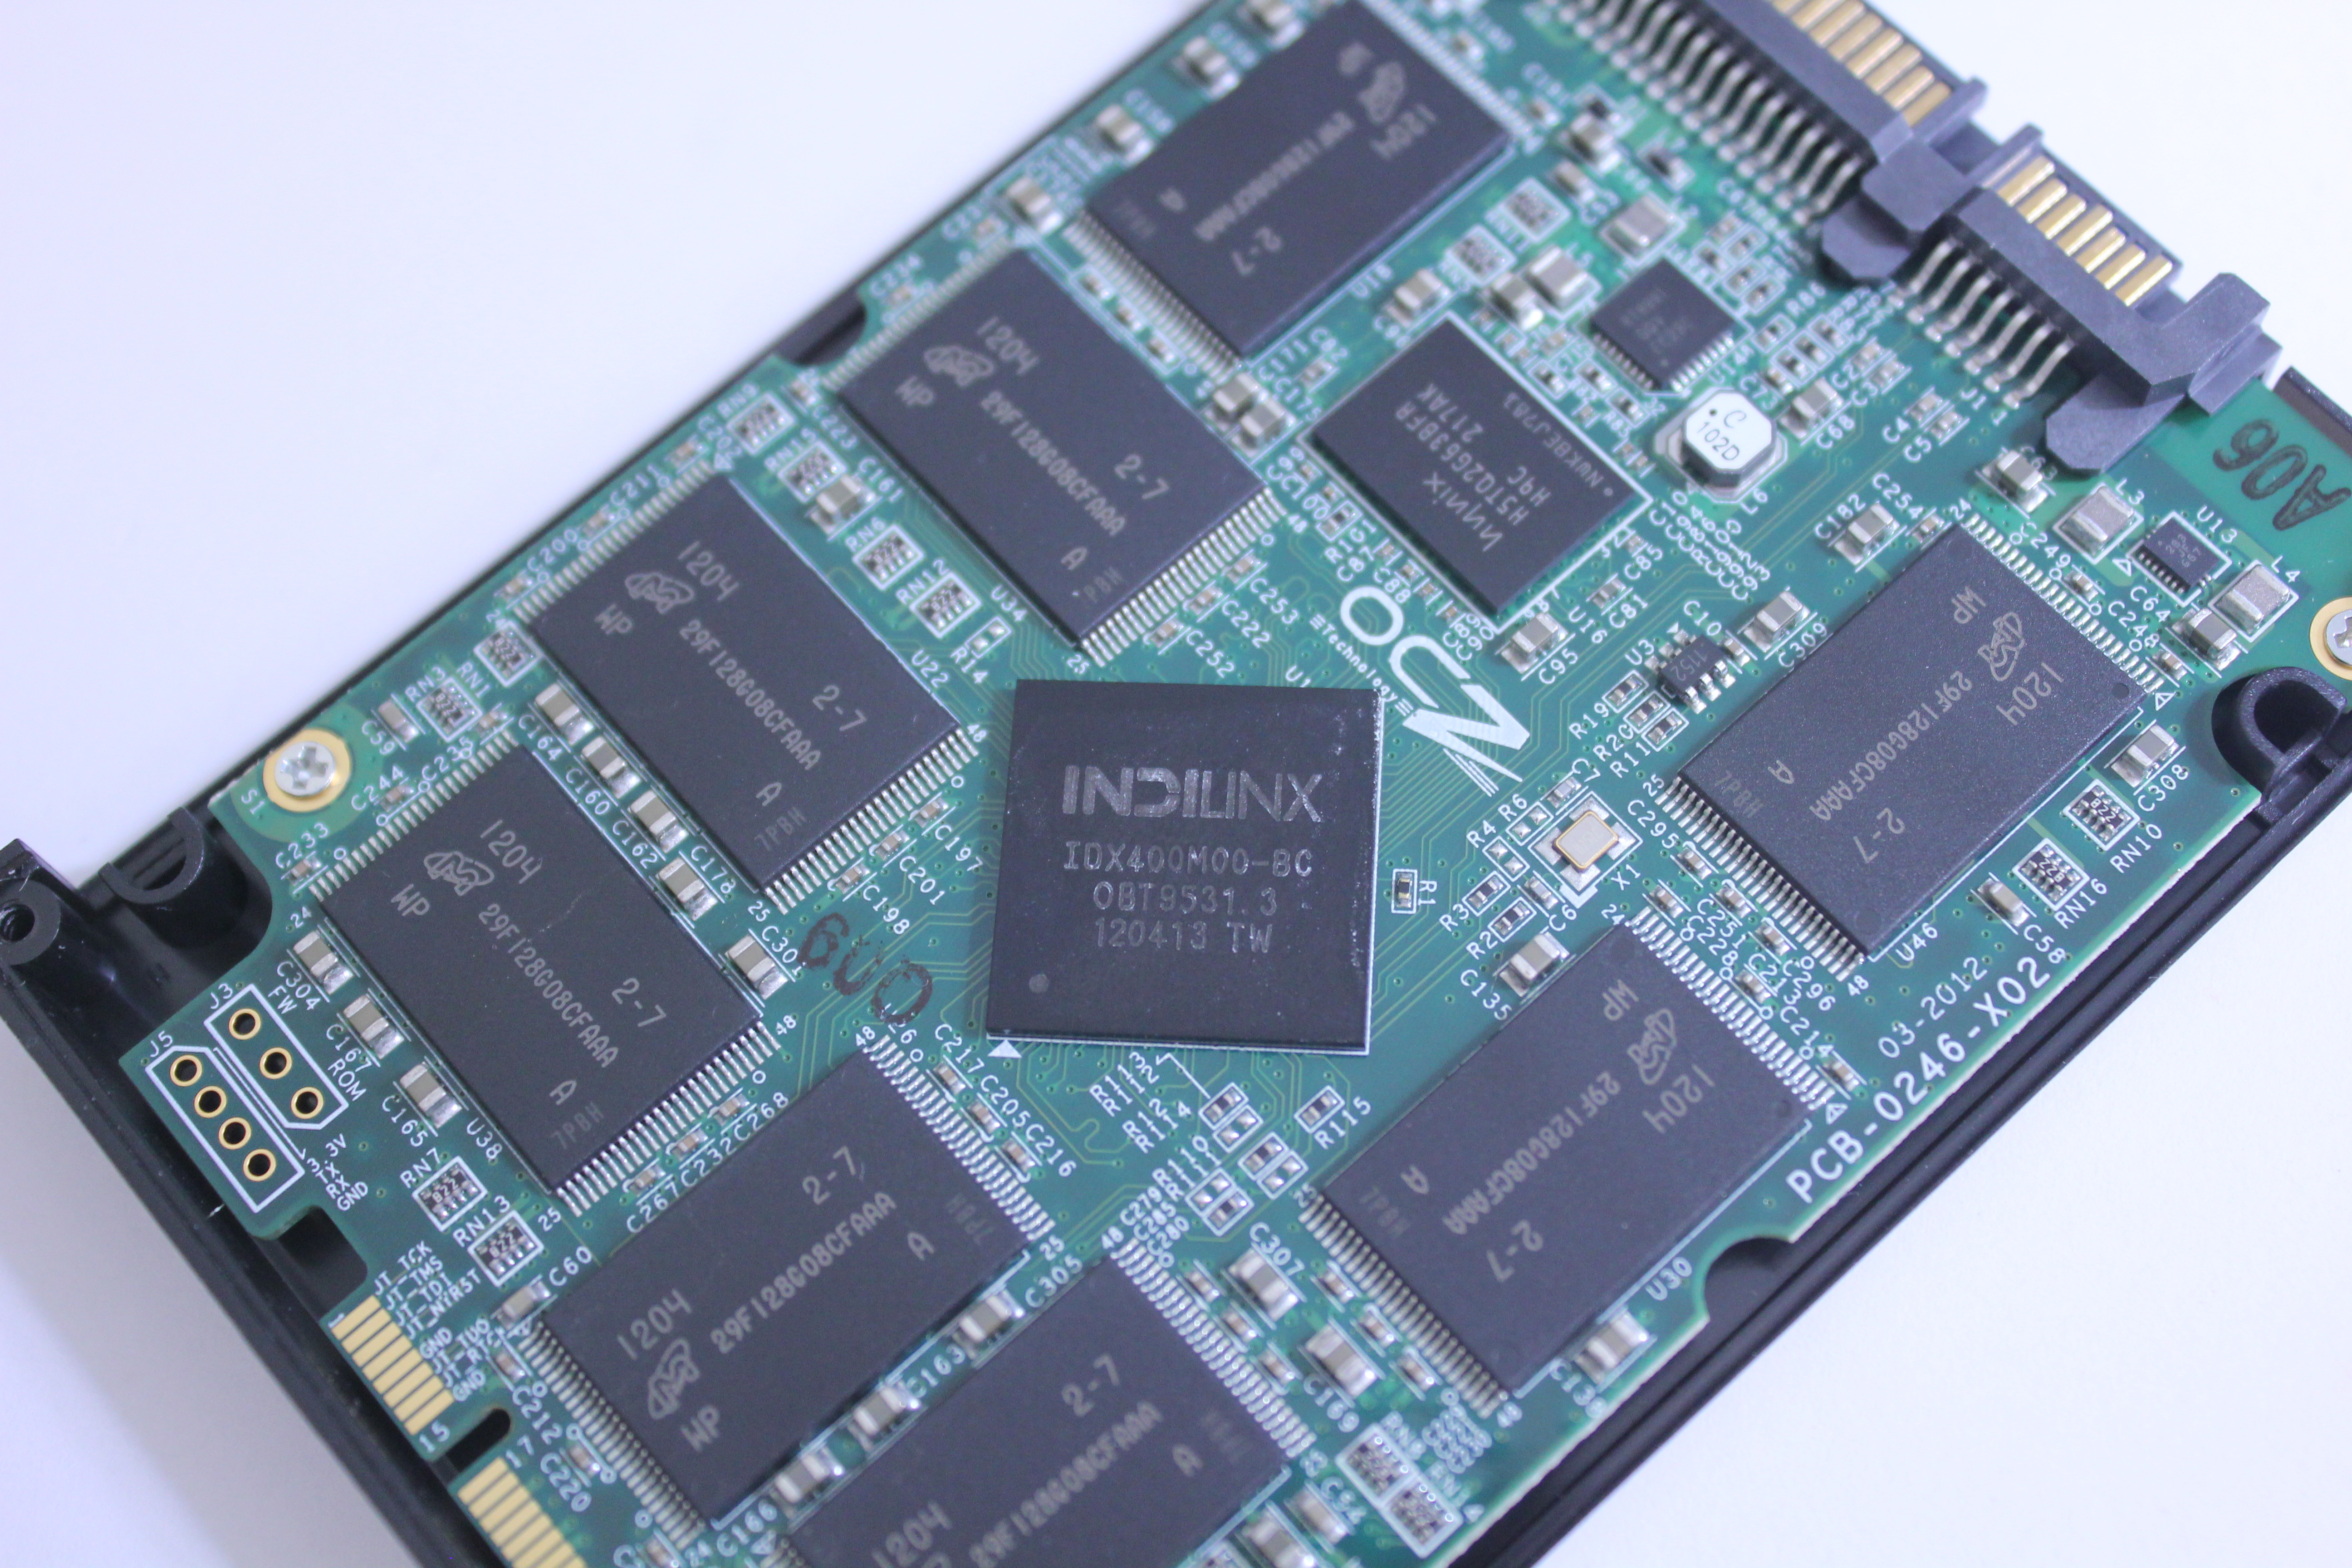
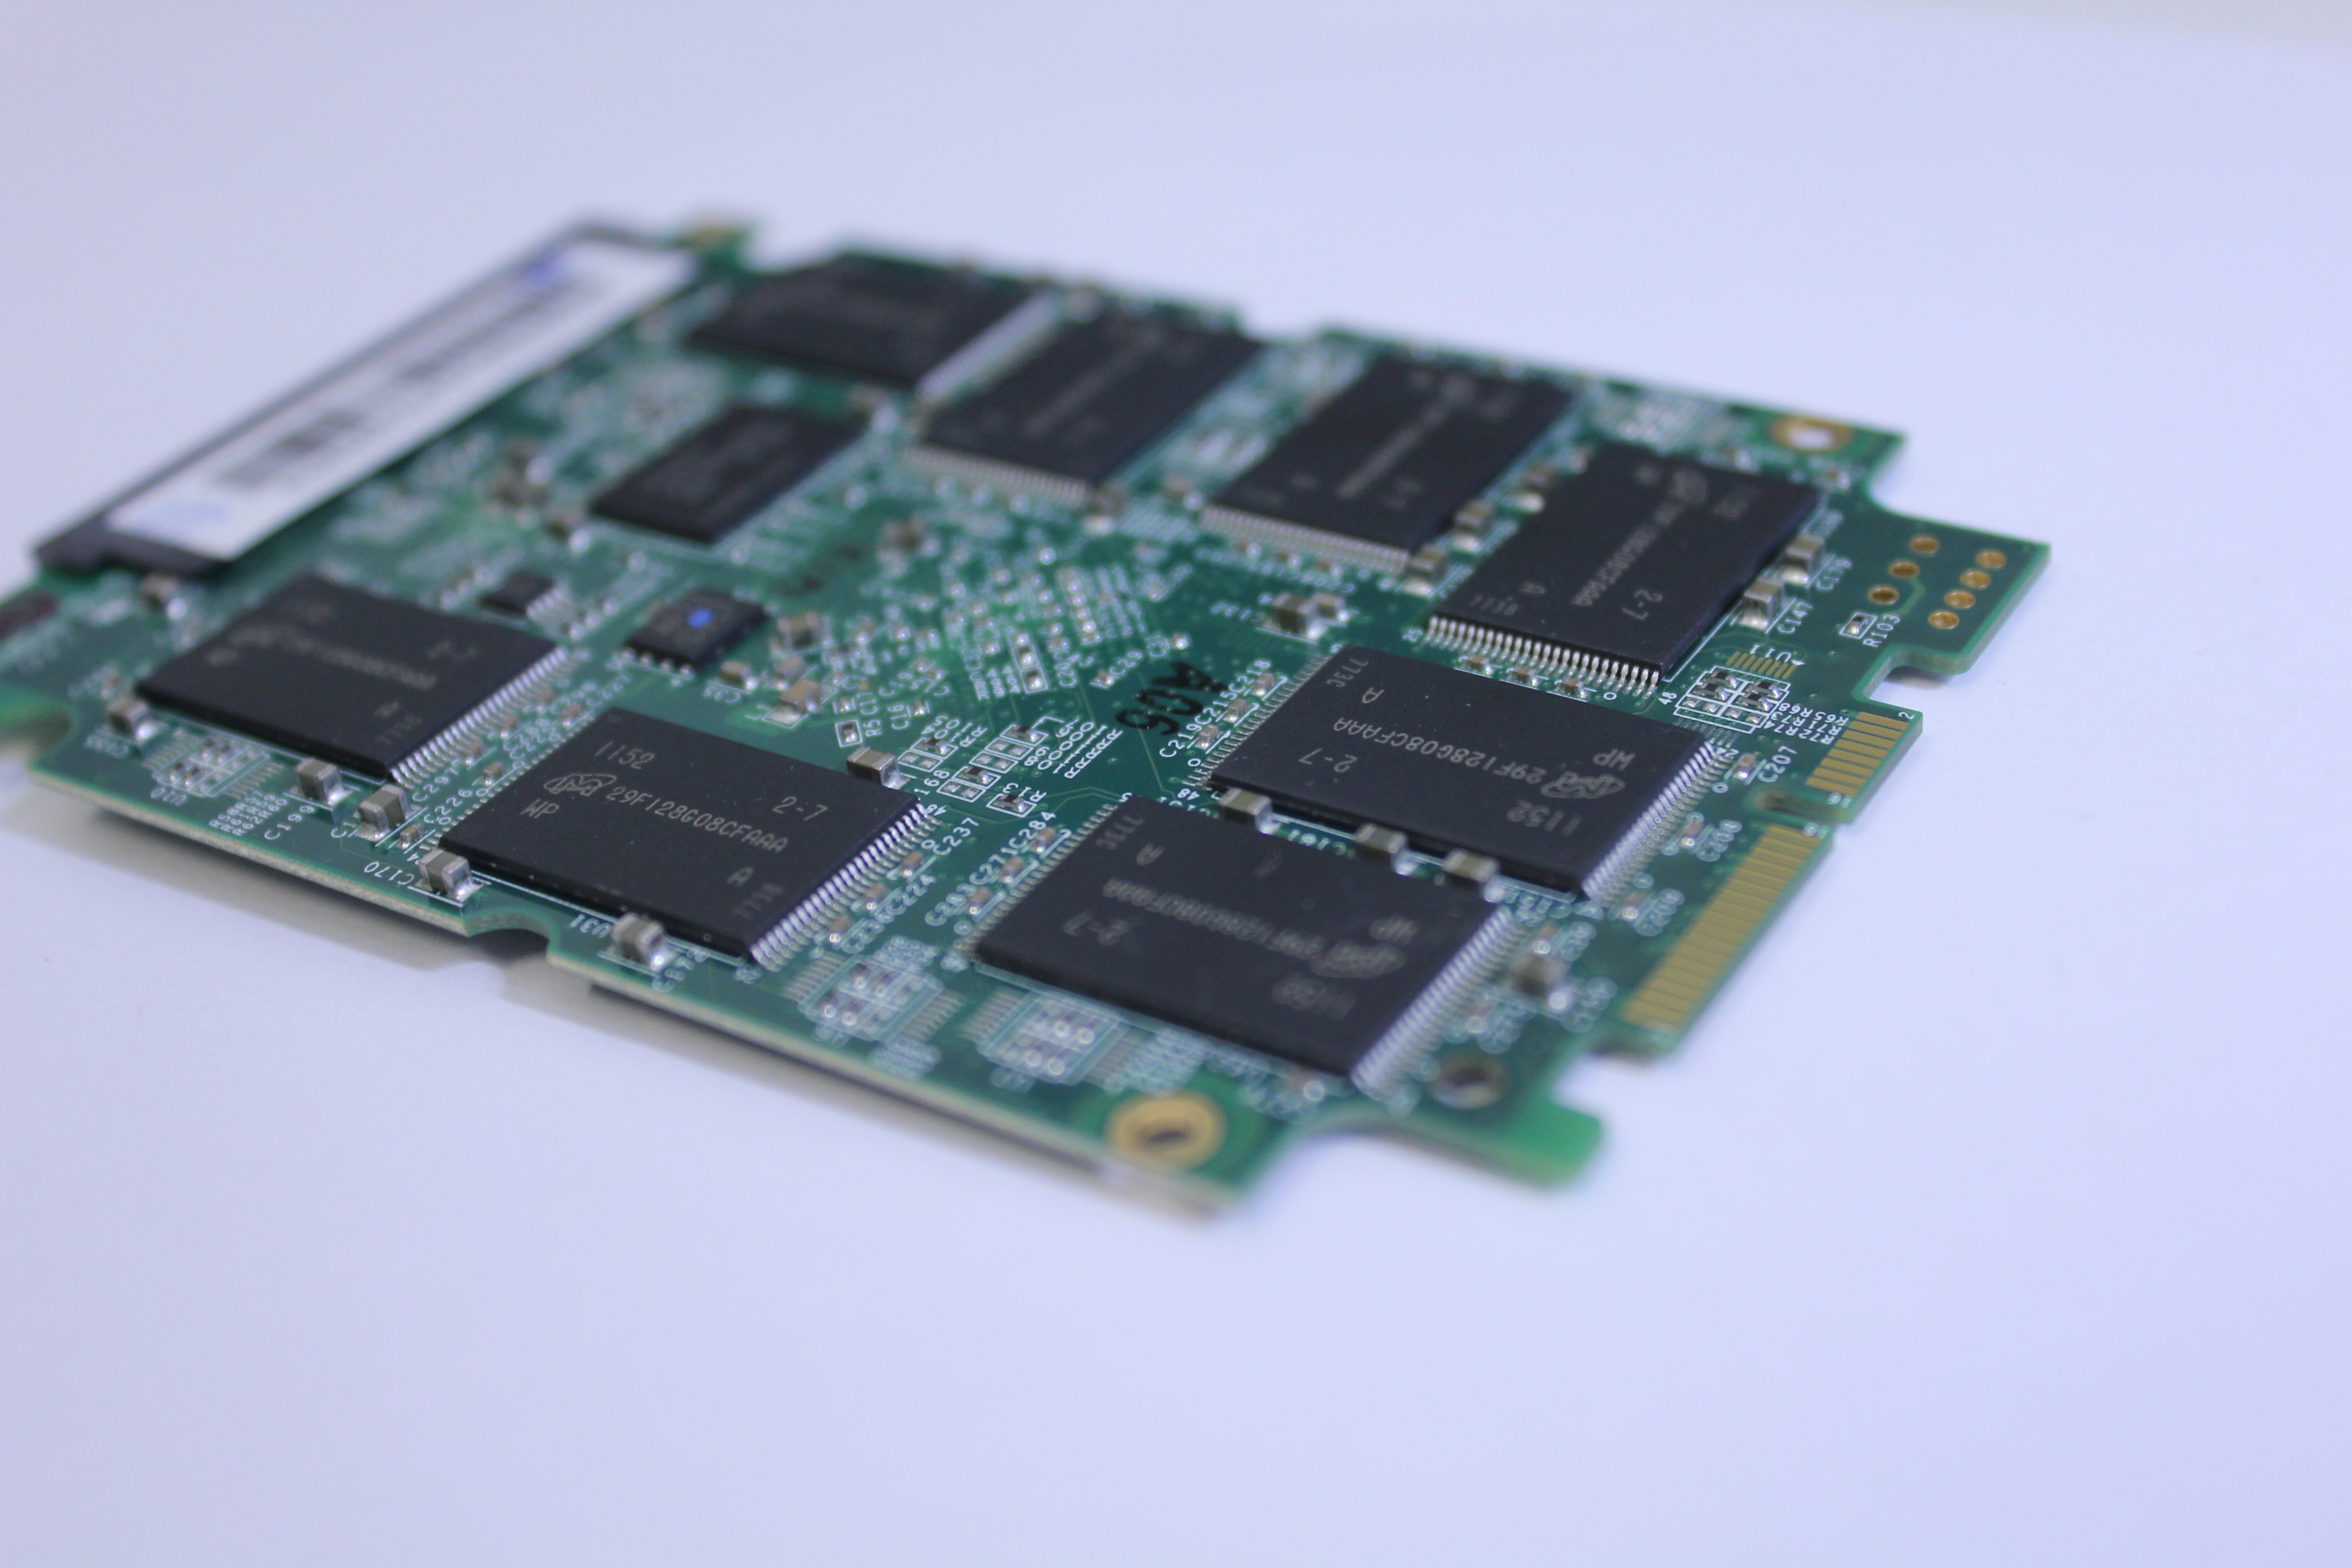
The controller is the same Indilinx IDX400MOO-BC (also known as Everest 2) as is found inside the Vertex 4. The silicon is provided by Marvell, although neither OCZ or Marvell has confirmed which exact silicon the Everest 2 is based on.

Similar to the Agility 3, the Agility 4 uses Micron's asynchronous NAND. As far as I can tell, Micron was the sole supplier of NAND for the Agility 3, so I would expect this trend to continue. There are eight NAND packages on each side of the PCB, bringing the total NAND package count to sixteen. Since our model is a 256GB version, each NAND package is 16GB (two 8GB dies).
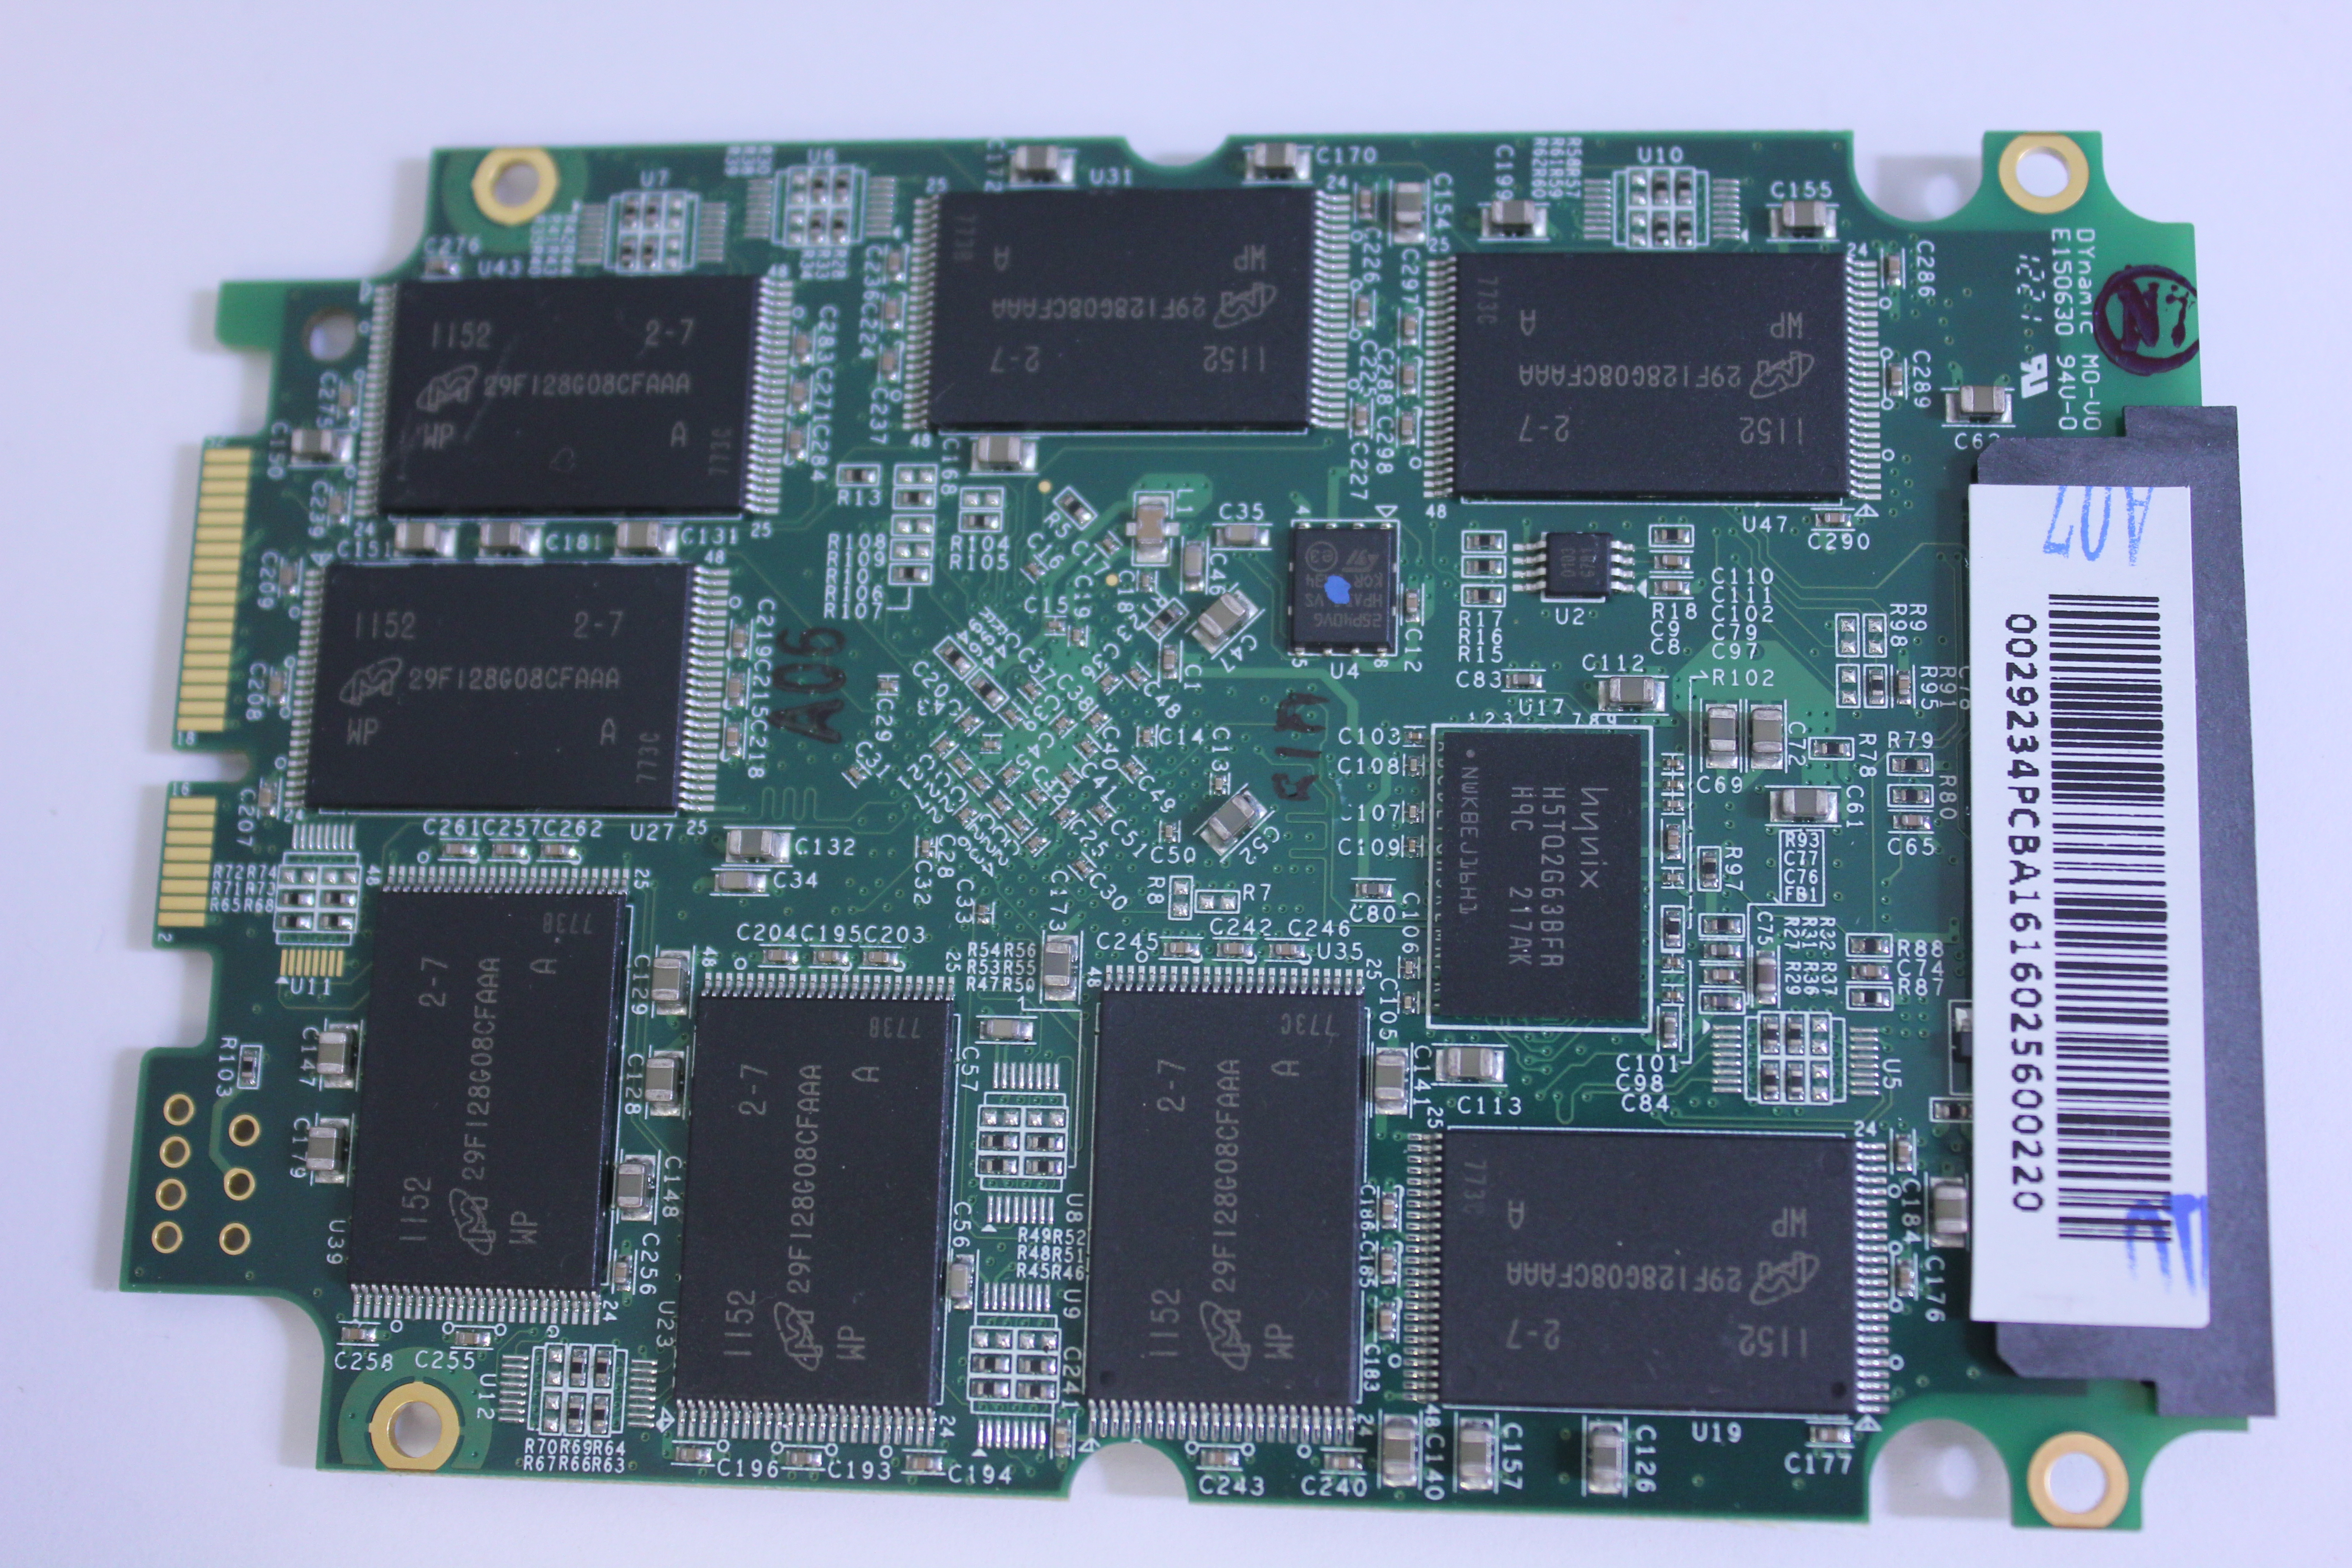
There are also two Hynix 256MB DDR-1333 chips. All our Vertex 4 samples have had Micron DRAM in them, though it's very likely that OCZ is using multiple suppliers.
Test System
| CPU |
Intel Core i5-2500K running at 3.3GHz (Turbo and EIST enabled) |
| Motherboard |
AsRock Z68 Pro3 |
| Chipset |
Intel Z68 |
| Chipset Drivers |
Intel 9.1.1.1015 + Intel RST 10.2 |
| Memory | G.Skill RipjawsX DDR3-1600 2 x 4GB (9-9-9-24) |
| Video Card |
XFX AMD Radeon HD 6850 XXX (800MHz core clock; 4.2GHz GDDR5 effective) |
| Video Drivers | AMD Catalyst 10.1 |
| Desktop Resolution | 1920 x 1080 |
| OS | Windows 7 x64 |
Random Read/Write Speed
The four corners of SSD performance are as follows: random read, random write, sequential read and sequential write speed. Random accesses are generally small in size, while sequential accesses tend to be larger and thus we have the four Iometer tests we use in all of our reviews. Our first test writes 4KB in a completely random pattern over an 8GB space of the drive to simulate the sort of random access that you'd see on an OS drive (even this is more stressful than a normal desktop user would see).
We perform three concurrent IOs and run the test for 3 minutes. The results reported are in average MB/s over the entire time. We use both standard pseudo randomly generated data for each write as well as fully random data to show you both the maximum and minimum performance offered by SandForce based drives in these tests. The average performance of SF drives will likely be somewhere in between the two values for each drive you see in the graphs. For an understanding of why this matters, read our original SandForce article.
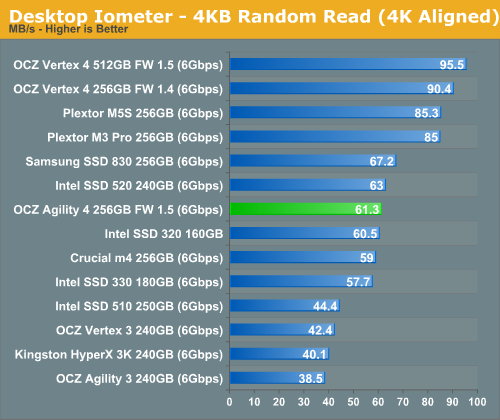
The performance difference between synchronous and asynchronous NAND is pretty clear here. At queue depth of 1, 4KB random reads are heavily dependent on the speed of NAND. Queue depth of 1 means that only one I/O request is sent at a time, which means the controller can only read from one NAND at a time (write combining helps work around this issue). Increasing queue depth allows the controller to read from multiple NAND dies at the same time, which leads to better performance especially when dealing with slower NAND (you can always hide latency with parallelism). Our 4KB random read test happens at queue depth of 3, which gives the Agility 4 some breathing room but it's still enough to show the difference between asynchronous and synchronous NAND.
Note that with bigger transfers, this is not as big issue because they are usually broken into smaller pieces and striped across multiple NAND dies, again allowing the controller to utilize multiple NAND dies simultaneously. Obviously, you need a fast controller and firmware to really notice the impact of slower NAND, which is exactly what the Everest 2 is.
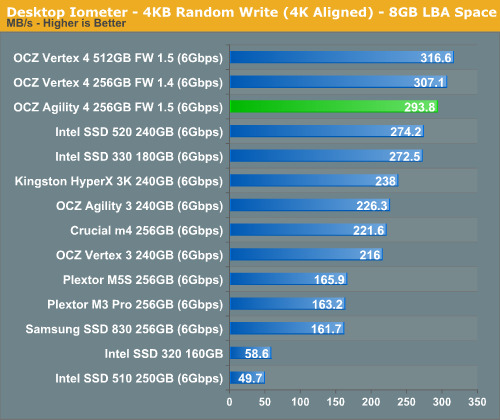
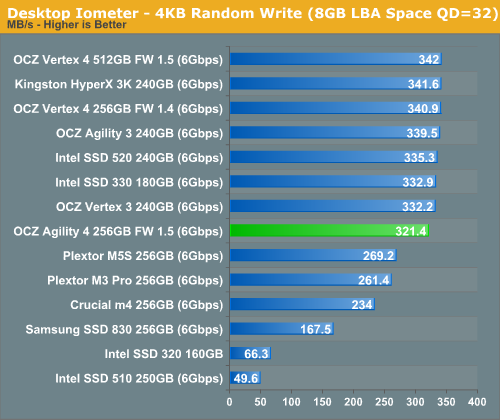
Random write performance isn't impacted as much by the slower NAND, not even at queue depth of 1. When reading data from an SSD, the data has to be fetched from the actual NAND, which can create a bottleneck with slower NAND. Write IOs, on the other hand, can be cached to much faster DRAM before written to NAND. Today's SSDs have fairly big caches so the NAND will have plenty of time to catch up. Of course, ultimately you will hit a wall and the NAND becomes a bottleneck. After our 20 minute torture session (4KB random writes at queue depth of 32 and 100% LBA space ran on a full drive), the Agility 4 was writing at 19.1MB/s, while 256GB Vertex 4 was chugging along at 28.4MB/s.
Sequential Read/Write Speed
To measure sequential performance we ran a one minute long 128KB sequential test over the entire span of the drive at a queue depth of 1. The results reported are in average MB/s over the entire test length.
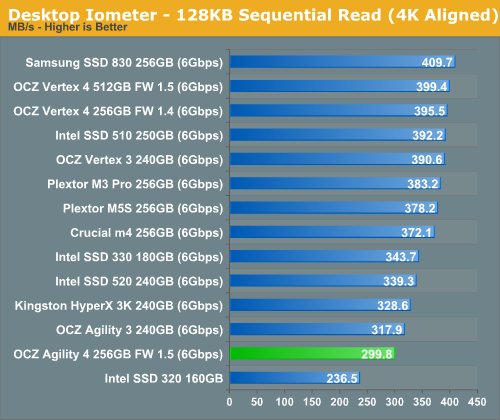
Sequential read performance is slower compared to Vertex 4 so we are definitely being limited by NAND here.
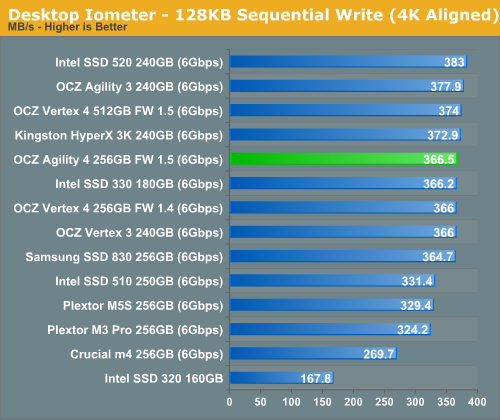
Sequential write speed is in fact on-par with Vertex 4. The bottleneck is obviously something else than NAND because quite a few drives are hitting the same speeds. We're likely running into the limits of how much parallelism you can extract from a low queue depth 128KB sequential transfer.
AS-SSD Incompressible Sequential Performance
The AS-SSD sequential benchmark uses incompressible data for all of its transfers. The result is a pretty big reduction in sequential write speed on SandForce based controllers, while other drives continue to work at roughly the same speed as with compressible data.
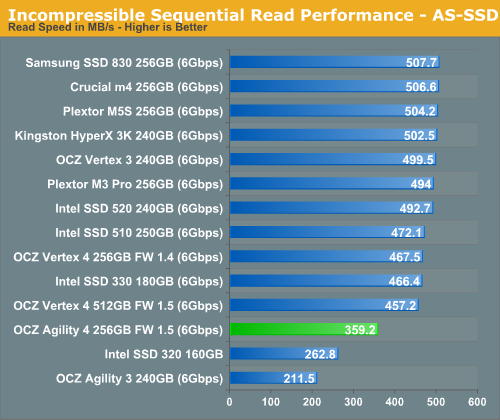
Incompressible sequential read performance is nowhere near as bad as it was with Agility 3, but it's significantly behind other drives.
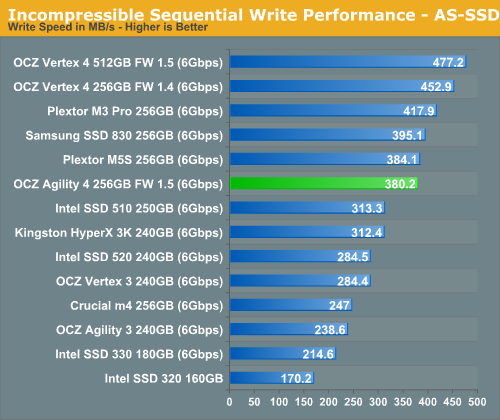
Incompressible sequential write performance is not Vertex 4 level, but still a bit better than average.
Performance vs. Transfer Size
All of our IOmeter sequential tests happen at a queue depth of 1, which is indicative of a light desktop workload. It isn't too far fetched to see much higher queue depths on the desktop. The performance of these SSDs also greatly varies based on the size of the transfer. For this next test we turn to ATTO and run a sequential write over a 2GB span of LBAs at a queue depth of 4 and varying the size of the transfers.
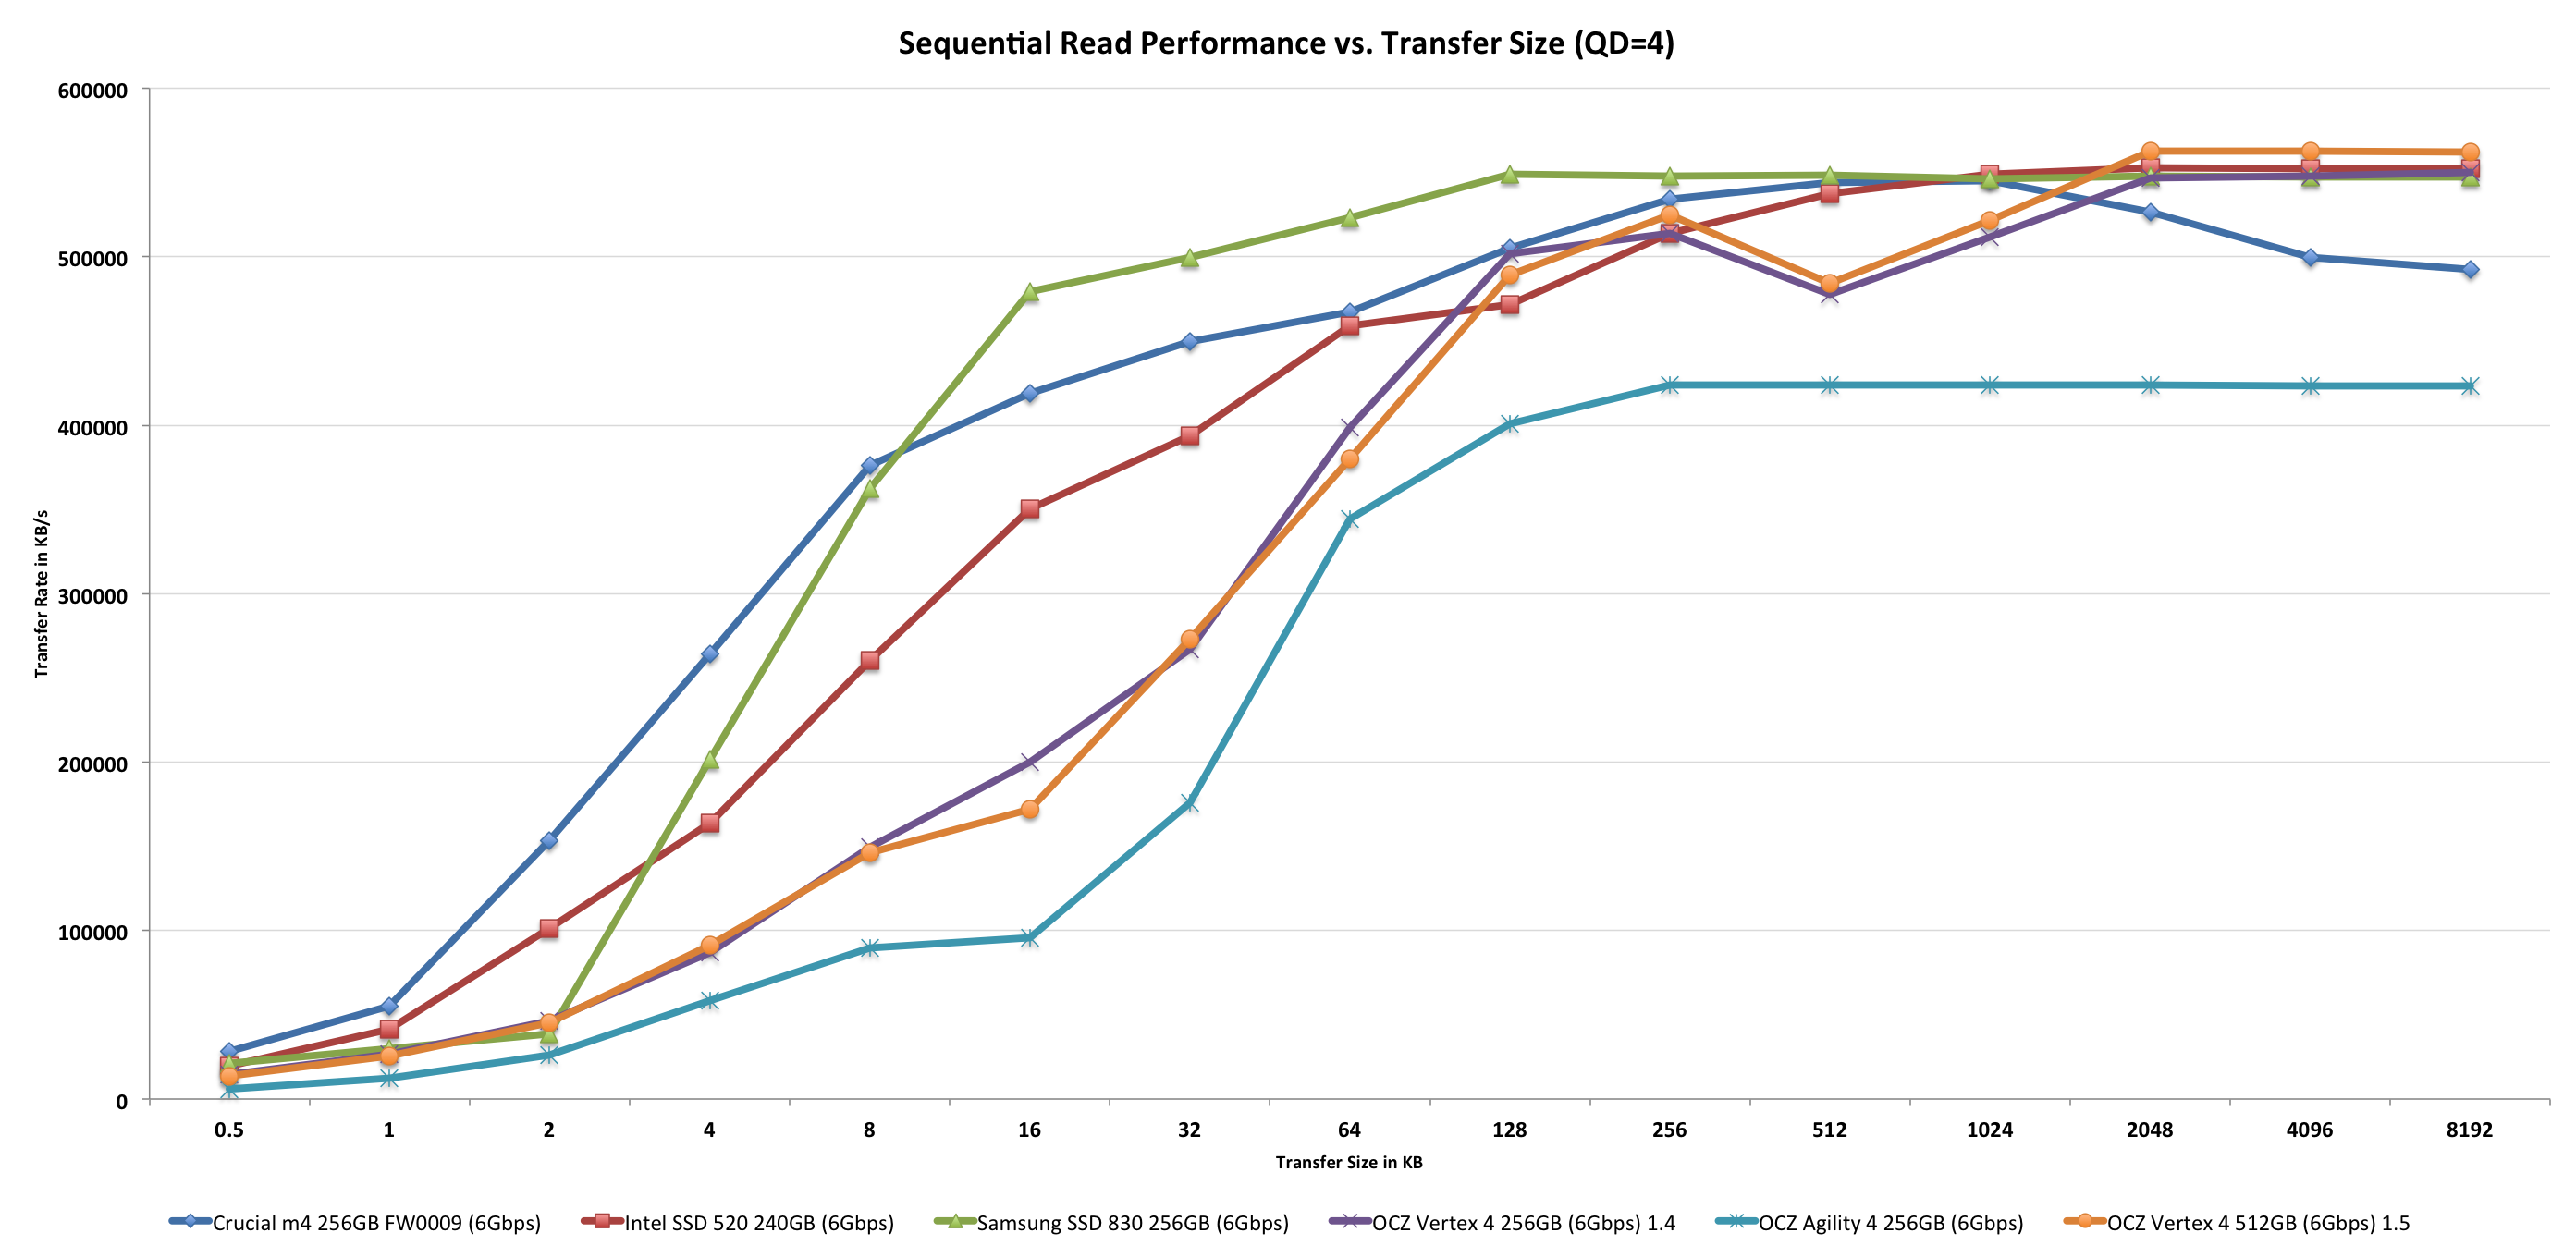
One of our main complaints about the firmware 1.4/1.5 for Vertex 4 was poor sequential read performance at small transfer sizes. Unfortunately, Agility 4 is even worse. With larger transfers, performance is okay, although not top notch. Once we go under 64KB IO size, the performance falls off considerably. For example at transfer size of 16KB, Agility 4 manages only 95.7MB/s, whereas Samsung 830 is reading at nearly 500MB/s. The good news is most client SSD performance isn't bound by small sequential transfers, but it's still a limitation of the drive.
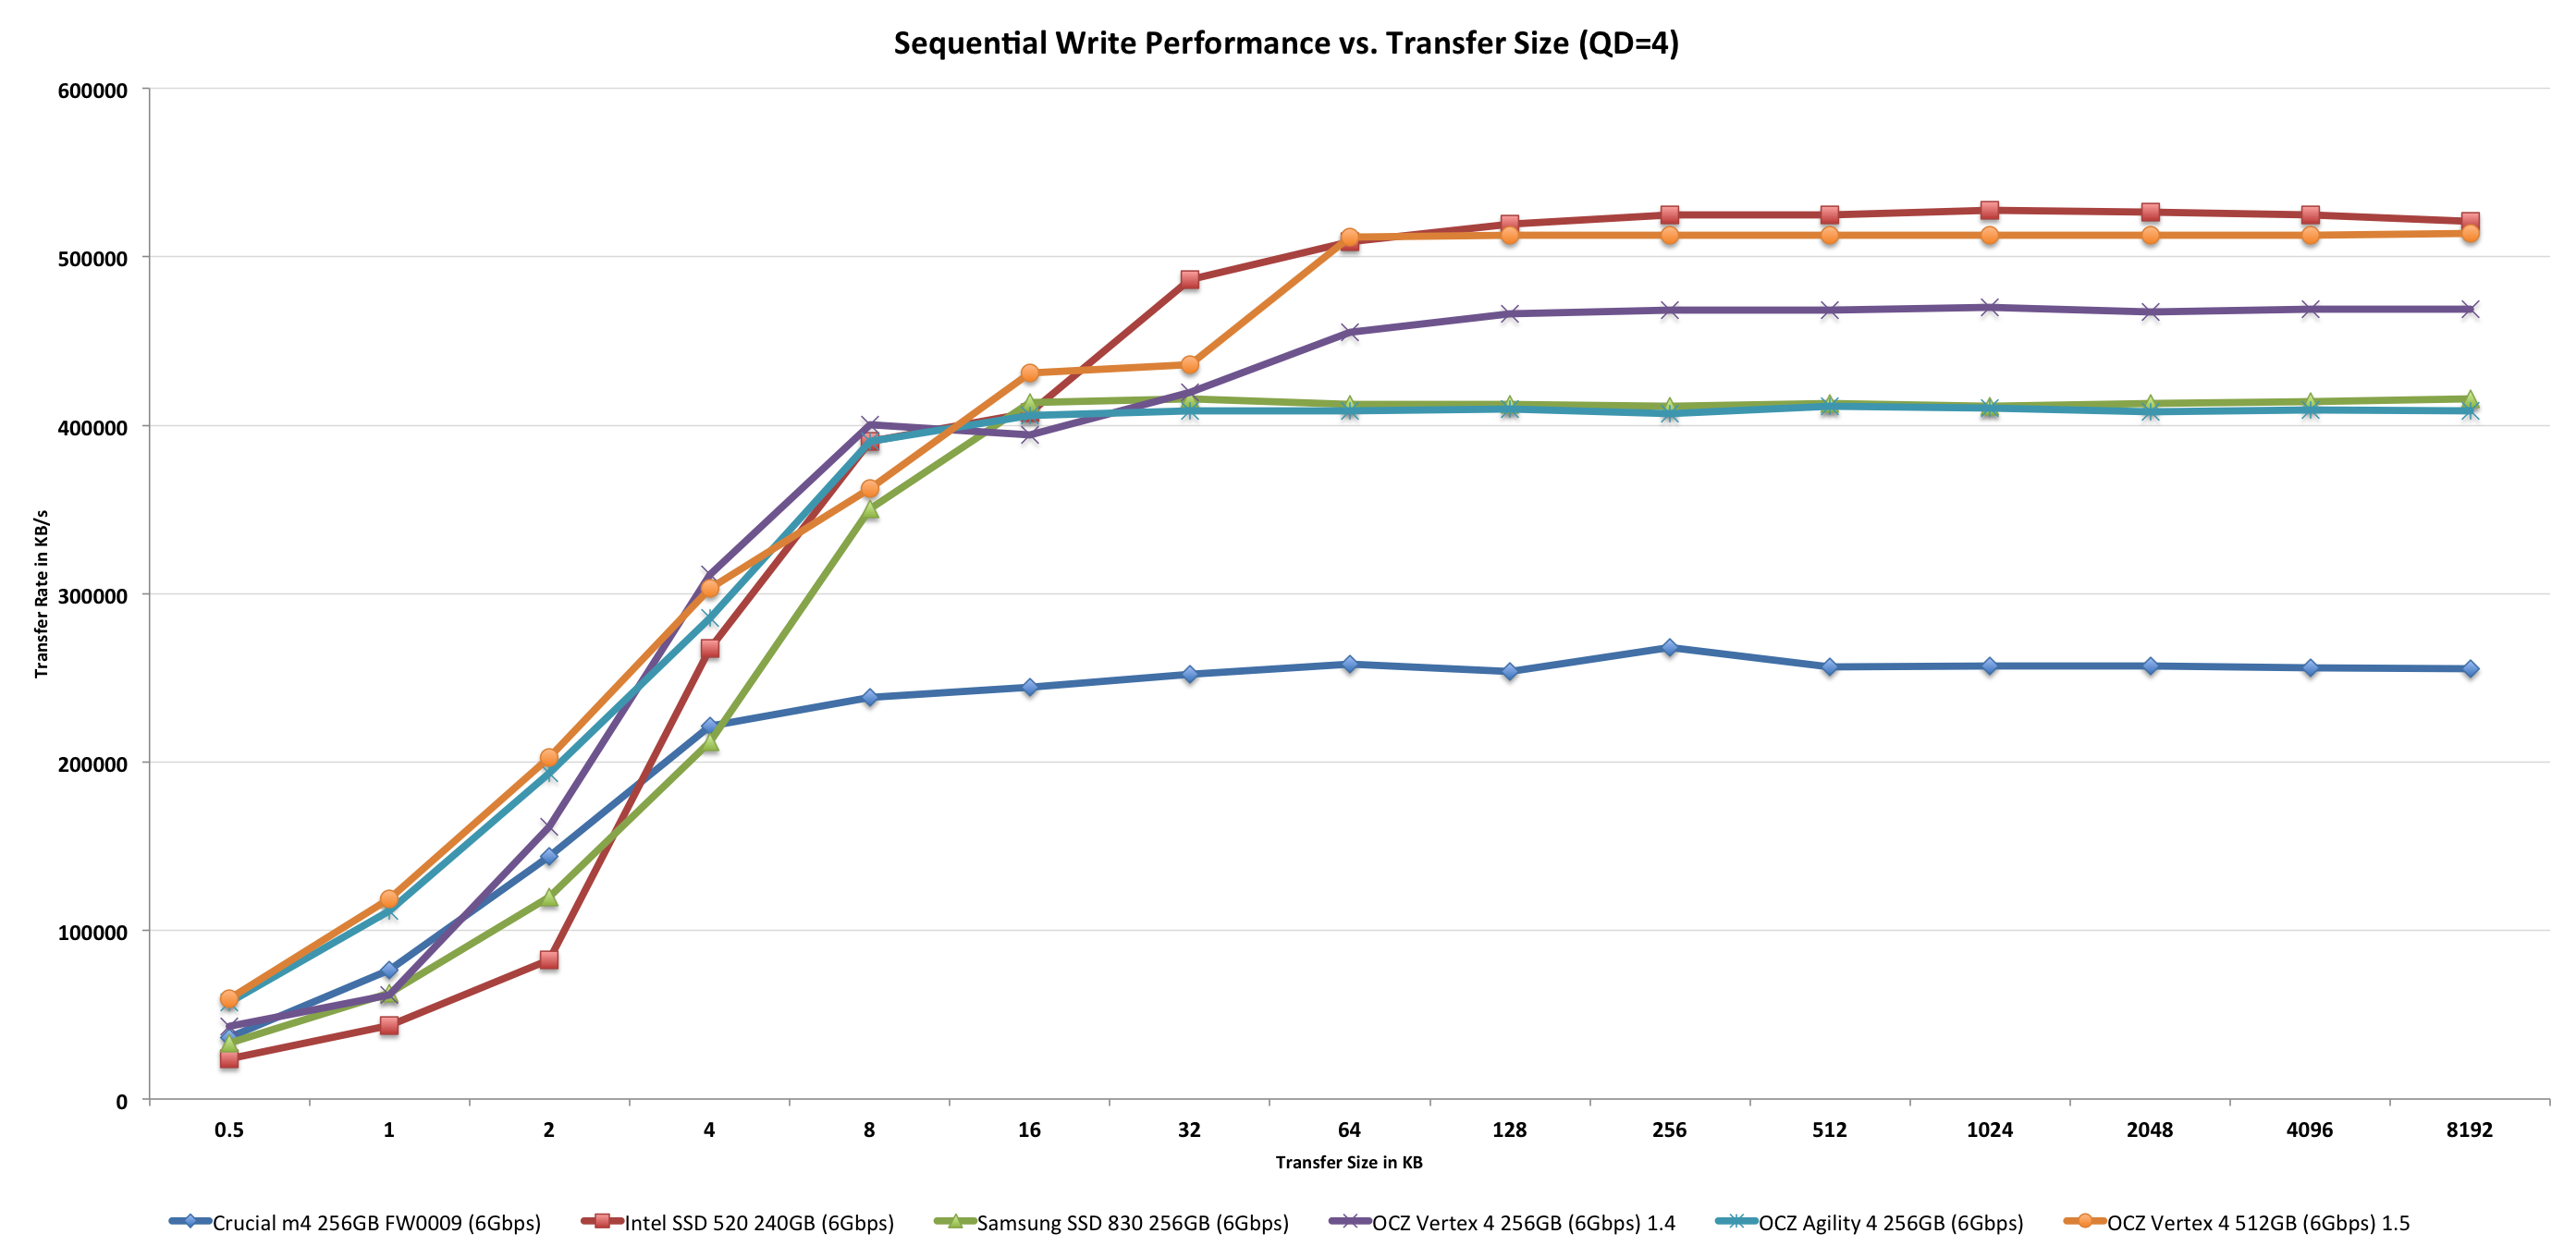
Fortunately there is no such problem with sequential write performance. Vertex 4 is still faster but only at bigger transfer sizes and even then the difference is not too bad (~50MB/s).
AnandTech Storage Bench 2011
Last year we introduced our AnandTech Storage Bench, a suite of benchmarks that took traces of real OS/application usage and played them back in a repeatable manner. Anand assembled the traces out of frustration with the majority of what we have today in terms of SSD benchmarks.
Although the AnandTech Storage Bench tests did a good job of characterizing SSD performance, they weren't stressful enough. All of the tests performed less than 10GB of reads/writes and typically involved only 4GB of writes specifically. That's not even enough exceed the spare area on most SSDs. Most canned SSD benchmarks don't even come close to writing a single gigabyte of data, but that doesn't mean that simply writing 4GB is acceptable.
Originally we kept the benchmarks short enough that they wouldn't be a burden to run (~30 minutes) but long enough that they were representative of what a power user might do with their system. Later, however, we created what we refer to as the Mother of All SSD Benchmarks (MOASB). Rather than only writing 4GB of data to the drive, this benchmark writes 106.32GB. This represents the load you'd put on a drive after nearly two weeks of constant usage. And it takes a long time to run.
1) The MOASB, officially called AnandTech Storage Bench 2011—Heavy Workload, mainly focuses on the times when your I/O activity is the highest. There is a lot of downloading and application installing that happens during the course of this test. Our thinking was that it's during application installs, file copies, downloading, and multitasking with all of this that you can really notice performance differences between drives.
2) We tried to cover as many bases as possible with the software incorporated into this test. There's a lot of photo editing in Photoshop, HTML editing in Dreamweaver, web browsing, game playing/level loading (Starcraft II and WoW are both a part of the test), as well as general use stuff (application installing, virus scanning). We included a large amount of email downloading, document creation, and editing as well. To top it all off we even use Visual Studio 2008 to build Chromium during the test.
The test has 2,168,893 read operations and 1,783,447 write operations. The IO breakdown is as follows:
| AnandTech Storage Bench 2011—Heavy Workload IO Breakdown | ||||
| IO Size | % of Total | |||
| 4KB | 28% | |||
| 16KB | 10% | |||
| 32KB | 10% | |||
| 64KB | 4% | |||
Only 42% of all operations are sequential; the rest ranges from pseudo to fully random (with most falling in the pseudo-random category). Average queue depth is 4.625 IOs, with 59% of operations taking place in an IO queue of 1.
Many of you have asked for a better way to really characterize performance. Simply looking at IOPS doesn't really say much. As a result we're going to be presenting Storage Bench 2011 data in a slightly different way. We'll have performance represented as Average MB/s, with higher numbers being better. At the same time we'll be reporting how long the SSD was busy while running this test. These disk busy graphs will show you exactly how much time was shaved off by using a faster drive vs. a slower one during the course of this test. Finally, we will also break out performance into reads, writes, and combined. The reason we do this is to help balance out the fact that this test is unusually write intensive, which can often hide the benefits of a drive with good read performance.
There's also a new light workload for 2011. This is a far more reasonable, typical every day use case benchmark. It has lots of web browsing, photo editing (but with a greater focus on photo consumption), video playback, as well as some application installs and gaming. This test isn't nearly as write intensive as the MOASB but it's still multiple times more write intensive than what we were running last year.
We don't believe that these two benchmarks alone are enough to characterize the performance of a drive, but hopefully along with the rest of our tests they will help provide a better idea. The testbed for Storage Bench 2011 has changed as well. We're now using a Sandy Bridge platform with full 6Gbps support for these tests.
AnandTech Storage Bench 2011—Heavy Workload
We'll start out by looking at average data rate throughout our new heavy workload test:
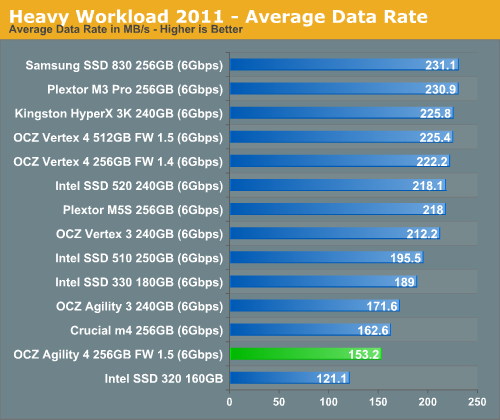
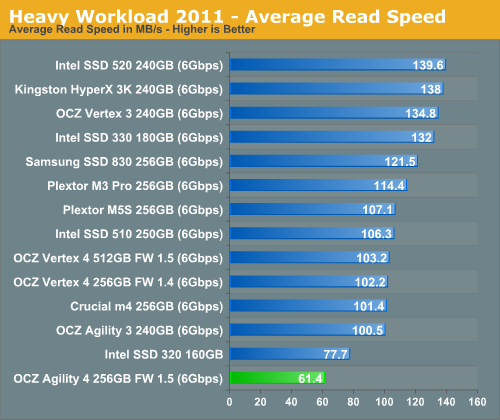
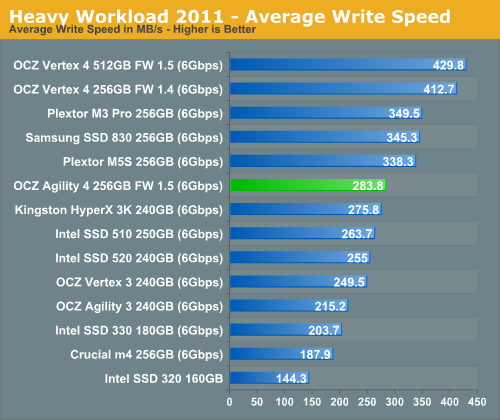
After going through all of our synthetic benchmarks, it shouldn't come as a surprise that the Agility 4 does not excel in our Storage Suites. Average write speed is fine, but read speed is from SATA 3Gbps era. Since the majority of IO operations of our Heavy suite are reads, the Agility 4 is slower than any other recent SATA 6Gbps SSD we have tested.
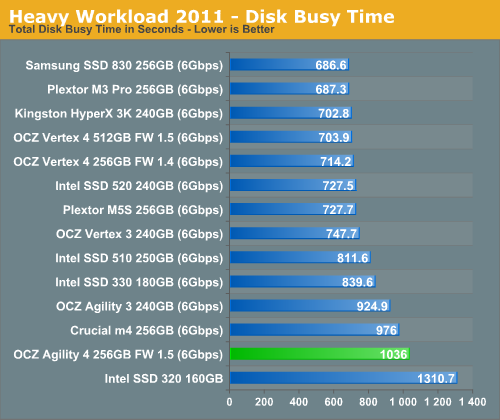
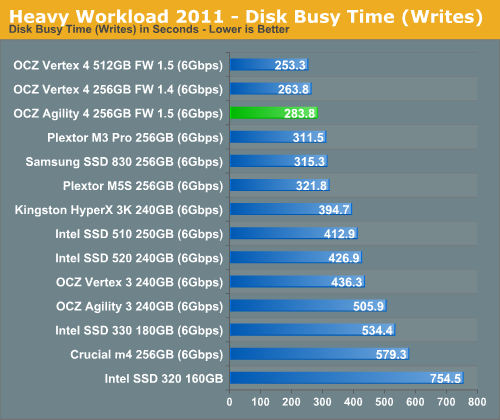
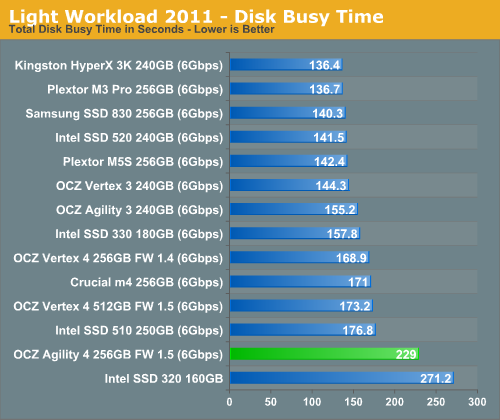
The next three charts just represent the same data, but in a different manner. Instead of looking at average data rate, we're looking at how long the disk was busy for during this entire test. Note that disk busy time excludes any and all idles; this is just how long the SSD was busy doing something:
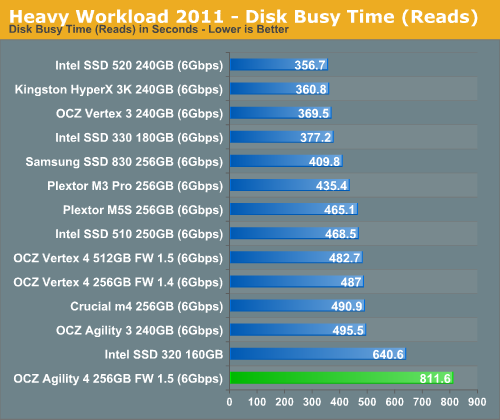
AnandTech Storage Bench 2011, Light Workload
Our new light workload actually has more write operations than read operations. The split is as follows: 372,630 reads and 459,709 writes. The relatively close read/write ratio does better mimic a typical light workload (although even lighter workloads would be far more read centric). The I/O breakdown is similar to the heavy workload at small IOs, however you'll notice that there are far fewer large IO transfers:
| AnandTech Storage Bench 2011—Light Workload IO Breakdown | ||||
| IO Size | % of Total | |||
| 4KB | 27% | |||
| 16KB | 8% | |||
| 32KB | 6% | |||
| 64KB | 5% | |||
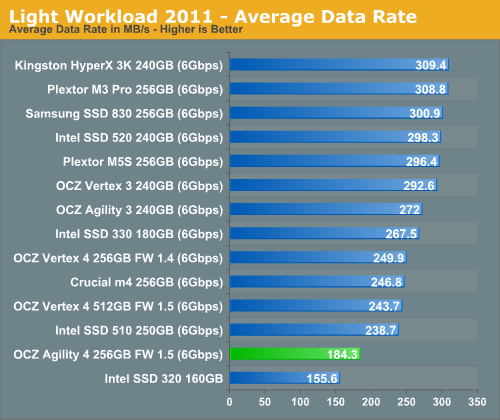
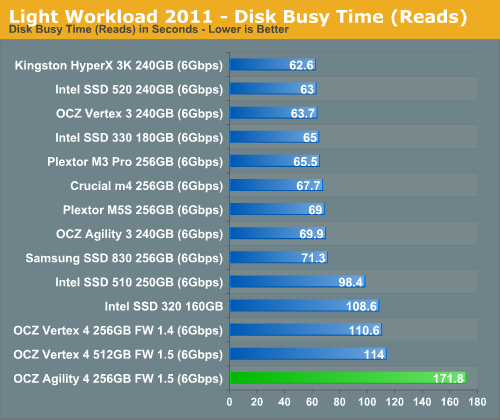
Agility 4 is even more behind other SSDs in our Light suite. Given that the average IO size and queue depth are smaller than in our Heavy suite, this was expected, but the result is not pleasing by any means.
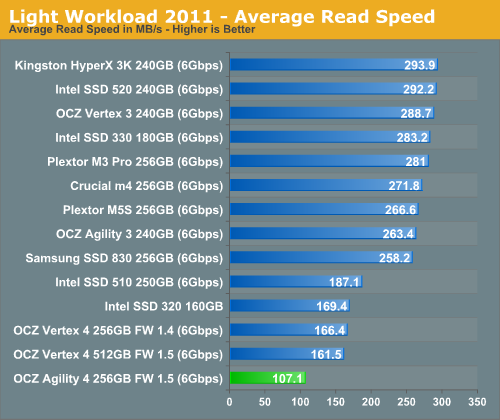
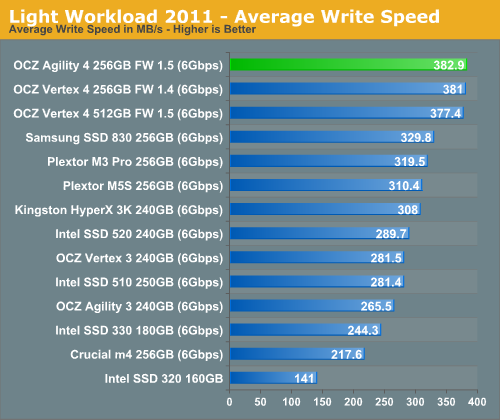
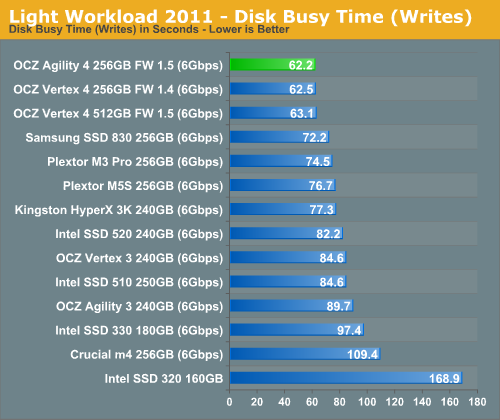
Surprisingly, the Agility 4 is faster than Vertex 4 when it comes to average write speed, but that is not enough to make up for the extremely poor read performance.
Performance Over Time & TRIM
For starters, I ran HD Tach on a secure erased drive to get the baseline performance:
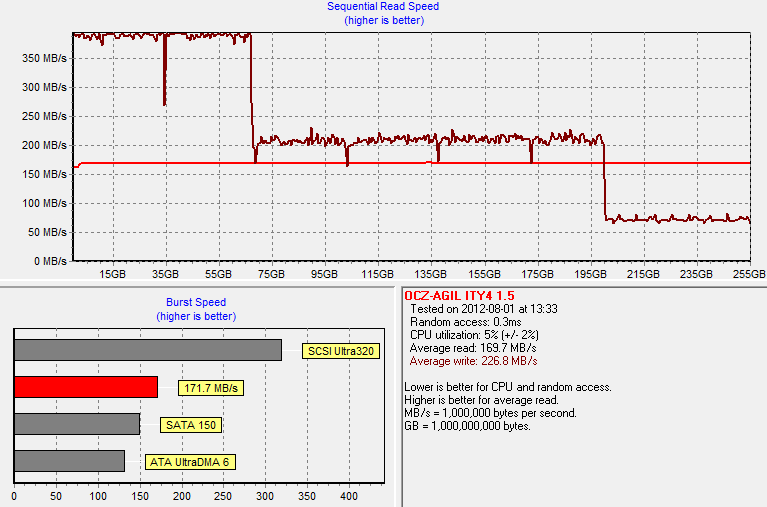
What you are seeing in the above graph is a new feature in the 1.5 firmware called performance mode. At first, write performance is great at nearly 400MB/s but after about 25% of the drive has been filled, write speed drops to ~200MB/s. Once ~80% of the drive has been filled, write speed drops to around 75MB/s. At smaller drive utilization points, OCZ takes advantage of having a lot of unused NAND and through some proprietary firmware magic it enables lower write latencies. As you fill the drive, OCZ's firmware has to reorganize internal pages and thus you see tangible performance drops as you pass certain capacity points.
Next I secure erased the drive, filled it with compressible data and tortured it with 4KB random writes (QD=32, 100% LBA space) for 20 minutes:
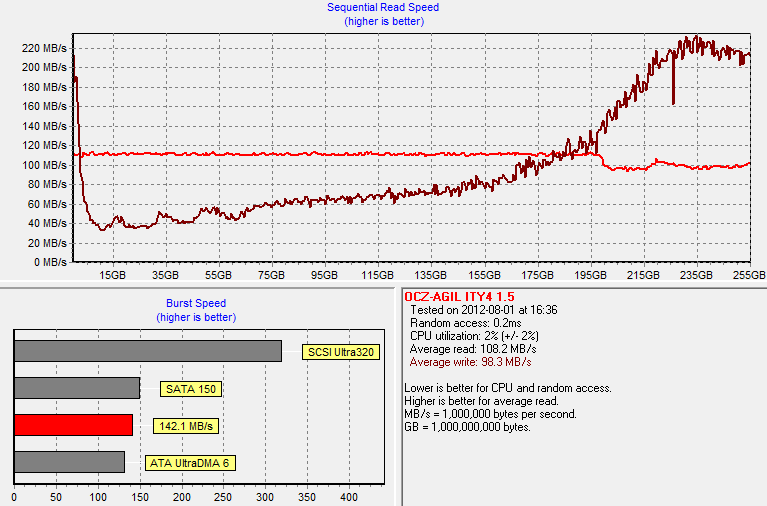
The behavior we are seeing here is similar to Vertex 4. Right after torture performance is pretty bad but garbage collection is doing its job as soon as you have written some sequential data to the drive.
I secure erase the drive and reran our torture test but instead of 20 minutes of treatment, I tortured the drive for 60 minutes:
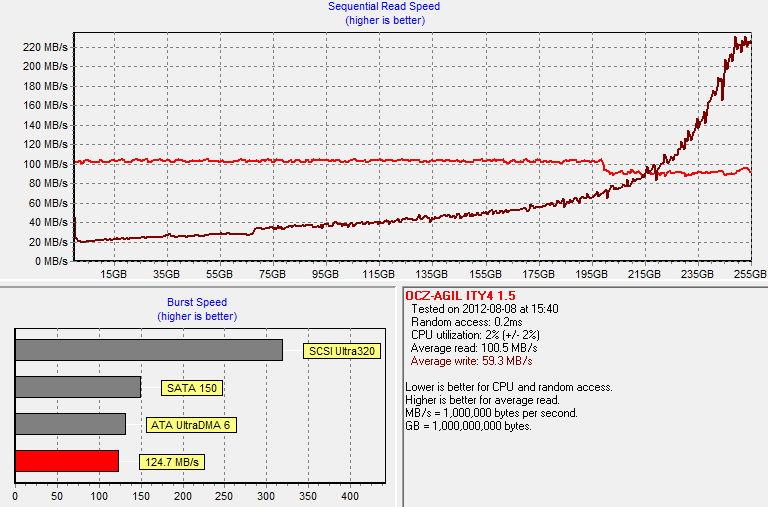
Write speed drops to as low as 20MB/s for the earliest LBAs. With most drives the worst case write speed is around 40-50MB/s, although asynchronous NAND probably has some impact here. Fortunately write speed is again restored when writing sequential data to the drive.
After running HD Tach, I let the drive idle for 30 minutes and reran HD Tach:
.PNG)
Everest 2 isn't very aggressive when it comes to idle garbage collection. Write speed already restored with first HD Tach pass and it stays at ~210MB/s. Remember that the drive is full of data and hence not running in performance mode; ~200MB/s write speed is normal when the drive is running in storage mode. Interestingly enough, read speed also degraded when tortured, and restored with idle time. This is not typical for non-SandForce SSDs, we'll have to do some more digging regarding this.
Finally I TRIM'ed the drive:

And TRIM works as it should. Formatting the drive sends a command to delete data in all user accessible LBAs, hence the drive is running in performance mode again for the first 25%.
Final Words
To date, we have only seen asynchronous NAND in SandForce SSDs and now I can see why. SandForce gets away with asynchronous NAND because it does real-time compression, meaning that it writes less to the NAND and hence there is also less to read. That's why Agility 3 performs so well and in most cases its performance is equal to the Vertex 3. Compression is an efficient way of eliminating the NAND bottleneck as long as you're dealing with compressible data. Once you switch to incompressible data, there is a big difference between Vertex 3 and Agility 3, all due to the NAND interface.
Without a real time compression engine, the Agility 4 is considerably slower than its counterpart equipped with synchronous NAND. It's clear OCZ is using its clever performance mode to hide a lot of the limitations of using asynchronous NAND. As you fill the drive the Agility 4's peak write performance drops considerably.
While Agility 4 is priced competitively, it's not cheap enough to be worth it. However, Vertex 4 is most likely a better investment in that case since it's only $5-20 more anyway.
Where the Agility 4 makes sense is when it's heavily discounted. As of late we've seen a couple of really hot deals on older SSDs. If you can find an Agility 4 for significantly less than the Crucial m4 or Samsung SSD 830 then it might be worth it. It's definitely faster than a mechanical drive at least. But at normal prices, the m4 or 830 for a little more would be a much better purchase.


